Examples
set_margin
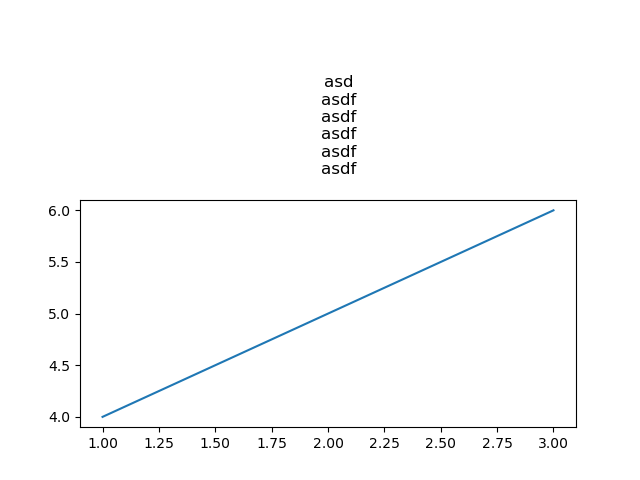
The set_marching function provides a fixed margin around a figure.
Unlike tight_layout, this method preserves the figure’s size.
It is particularly useful when creating figures for scientific articles where a specific figure size is desired.
[1]:
from IPython import get_ipython

# noinspection PyBroadException
try:
    _magic = get_ipython().run_line_magic
    _magic("load_ext", "autoreload")
    _magic("autoreload", "2")
except:
    pass

import uscit as ut
import matplotlib.pyplot as plt
[2]:
def export_file_to_temp(fig):
    import tempfile
    from PIL import Image
    from IPython.display import display


    # Save the plot to a temporary file
    with tempfile.NamedTemporaryFile(suffix='.png') as tmpfile:
        fig.savefig(tmpfile.name)

        # Open the temporary file as an image using PIL
        img = Image.open(tmpfile.name)
        display(img)
[3]:
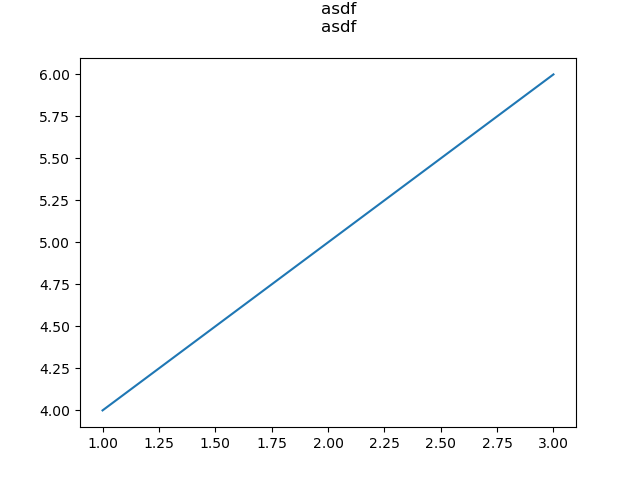
# Without modifying the margins
def create_figure():
    x = [1, 2, 3]
    y = [4, 5, 6]
    fig, ax = plt.subplots()
    ax.plot(x, y)
    plt.close(fig)
    ax.set_title('''
    asd
    asdf
    asdf
    asdf
    asdf
    asdf
    ''')
    return fig

fig  = create_figure()

export_file_to_temp(fig)
[4]:
# Modifying the margins using the function set_margin
fig  = create_figure()
ut.set_margin(f=fig, y2=2)
export_file_to_temp(fig)
set_fig_rule
[29]:
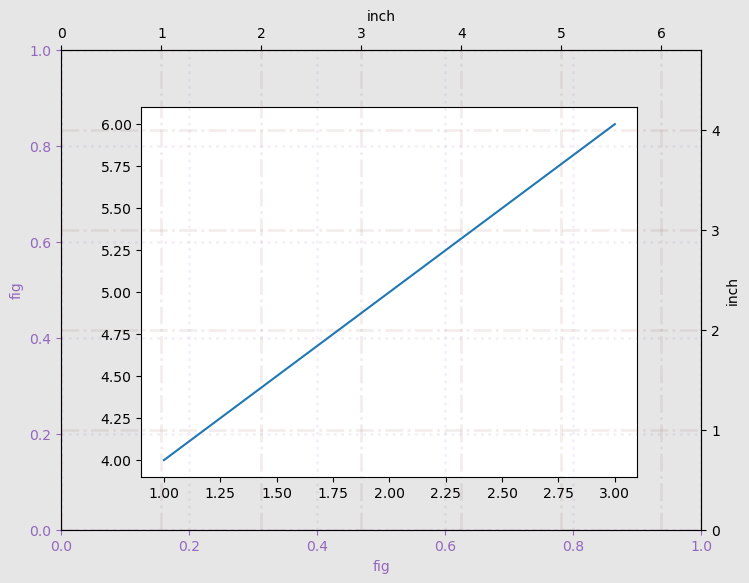
fig, ax = plt.subplots()
ax.plot([1, 2, 3], [4, 5, 6])
ut.set_fig_rule(f=fig, g=True)
try mac
[ ]: